PERFORMANCE VALIDATION / BEFORE → AFTER
PERFORMANCE VALIDATION / BEFORE → AFTER
Measured gains, without changing discharge pressure.
Measured gains, without changing discharge pressure.
Measured gains, without changing discharge pressure.
A direct comparison of airflow, specific power consumption, isentropic efficiency, and operating pressure after system optimization.
A direct comparison of airflow, specific power consumption, isentropic efficiency, and operating pressure after system optimization.
A direct comparison of airflow, specific power consumption, isentropic efficiency, and operating pressure after system optimization.
Comparison table
Comparison table
Result values highlighted
Metric
Metric
Metric
Before
Before
Before
After
After
After
Result
Result
Result
Airflow Capacity
Airflow Capacity
Airflow Capacity
711.20 m³/h
711.20 m³/h
711.20 m³/h
1,032.84 m³/h
1,032.84 m³/h
1,032.84 m³/h
+45.2%
+45.2%
+45.2%
Specific Power Consumption
Specific Power Consumption
Specific Power Consumption
0.1540
0.1540
0.1540
0.1209
0.1209
0.1209
−21.5%
−21.5%
−21.5%
Isentropic Efficiency
Isentropic Efficiency
Isentropic Efficiency
54.87%
54.87%
54.87%
68.22%
68.22%
68.22%
+13.35 points
+13.35 points
+13.35 points
Discharge Pressure
Discharge Pressure
Discharge Pressure
0.7000 MPaG
0.7000 MPaG
0.7000 MPaG
0.7000 MPaG
0.7000 MPaG
0.7000 MPaG
Maintained
Maintained
Maintained
OUTPUT VS. ENERGY INTENSITY
Before-and-after performance
Before-and-after performance
Airflow Capacity
Before
Before
711.20 m³/h
711.20 m³/h
After
After
1,032.84 m³/h
1,032.84 m³/h
Specific Power Consumption
Before
Before
0.1540
0.1540
After
After
0.1209
0.1209
Before
After
ENERGY FLOW
Compressor energy pathway
Compressor energy pathway
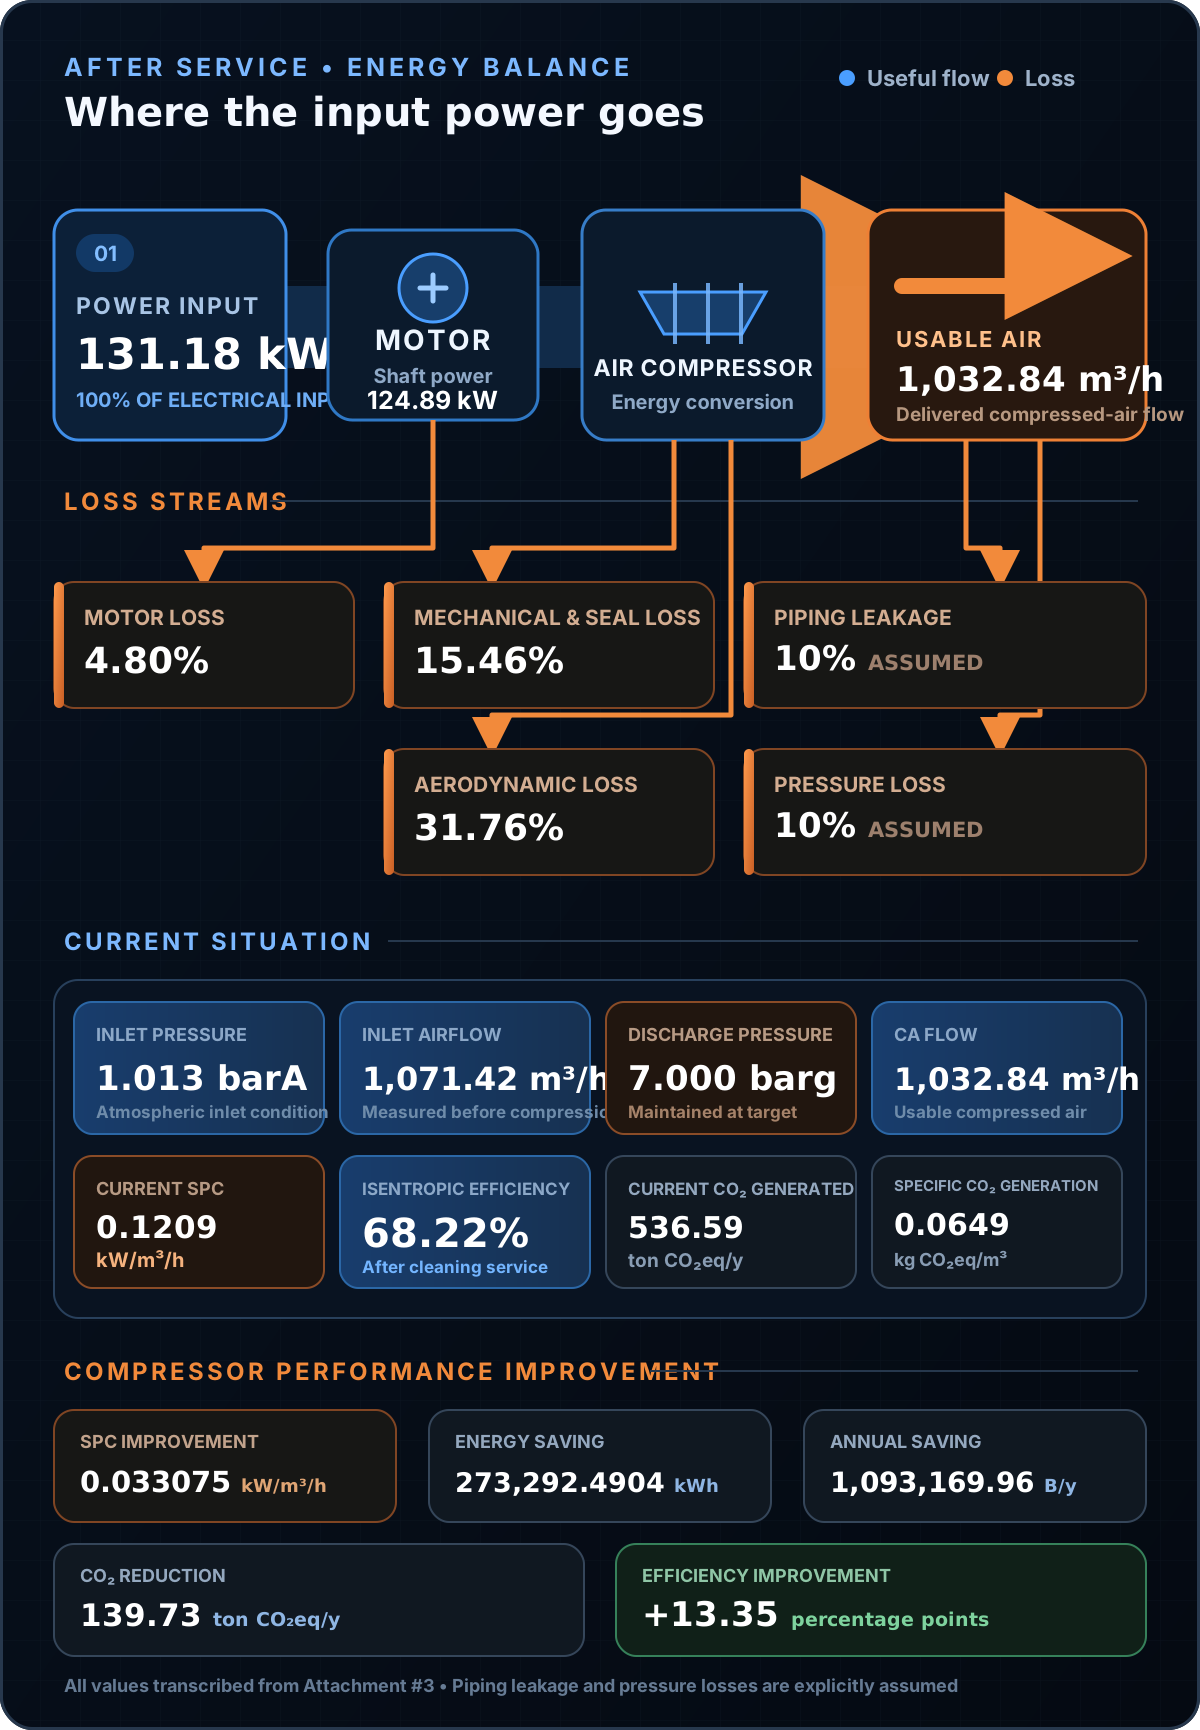

Energy-flow losses from Attachment #3. Assumed piping and pressure losses retained; identifying report data removed.
Energy-flow losses from Attachment #3. Assumed piping and pressure losses retained; identifying report data removed.